


Your P&L says COGS came in at 32% last period. The period before, it was 29%. Something changed, and it cost you money.
So what do you do with that number?
You could tell the kitchen to tighten up. You could call your protein vendor and push on price. You could trim a portion size. All of that takes effort, and none of it helps if protein was never the problem. Maybe protein is right where it should be, and produce is what jumped. Maybe the kitchen is over ordering greens that spoil before anyone uses them. Maybe a vendor has been sending product that goes straight in the trash.
One number cannot tell you which story is true. COGS broken out by category can.
Most of what sits on a restaurant P&L is hard to move. Rent is rent. Insurance renews once a year. Some utilities barely change from one period to the next. You can study those lines all day and the number will still be the number.
COGS is different. COGS stands for cost of goods sold, and some P&Ls call it cost of sales. It is what left the kitchen and went out to a table: the cost of the food, drinks and packaging behind every sale. It changes every week, and it is one of the biggest costs you control. That is exactly why a single total is not enough. It tells you the cost went up. It does not tell you what to fix.
Without a breakdown, you are shooting in the dark. You push on the vendor you happen to think of first, or you cut the portion that is easiest to cut, and you hope the next P&L looks better. With a breakdown, the question changes. It stops being "why is COGS high?" and becomes "why did produce go up when nothing on the menu changed?" The first question sends you guessing. The second one sends you to the walk-in.
Most restaurants group COGS into food and beverage, and some add packaging. Within those groups, these are the lines that move the most. How much each one matters depends on what you serve.
Cups, lids, to-go containers, napkins. Many quick-service and coffee operators count to-go packaging as COGS. Others carry paper goods as an operating expense. Either works, as long as you are consistent from period to period.
These are the lines most worth watching, not a complete list. Most charts of accounts go further, and the more detail you have, the faster you find the line that moved. A steakhouse might split protein into beef, poultry and seafood, so a jump in beef does not hide inside one protein total.
Here is an example with made-up numbers. It is an illustration, not a benchmark for any restaurant. Say a restaurant has $100,000 in sales in each of two periods. COGS is 29% in the first period and 32% in the second. That is $29,000 and then $32,000, a jump of $3,000.
On the P&L, one COGS total is all you see. Broken out by category, the same two periods look like this:
Protein is flat. Produce is up $2,800, which is nearly the whole $3,000. If you had spent the next two weeks squeezing your protein vendor, you would have worked hard on a line that was never the issue.
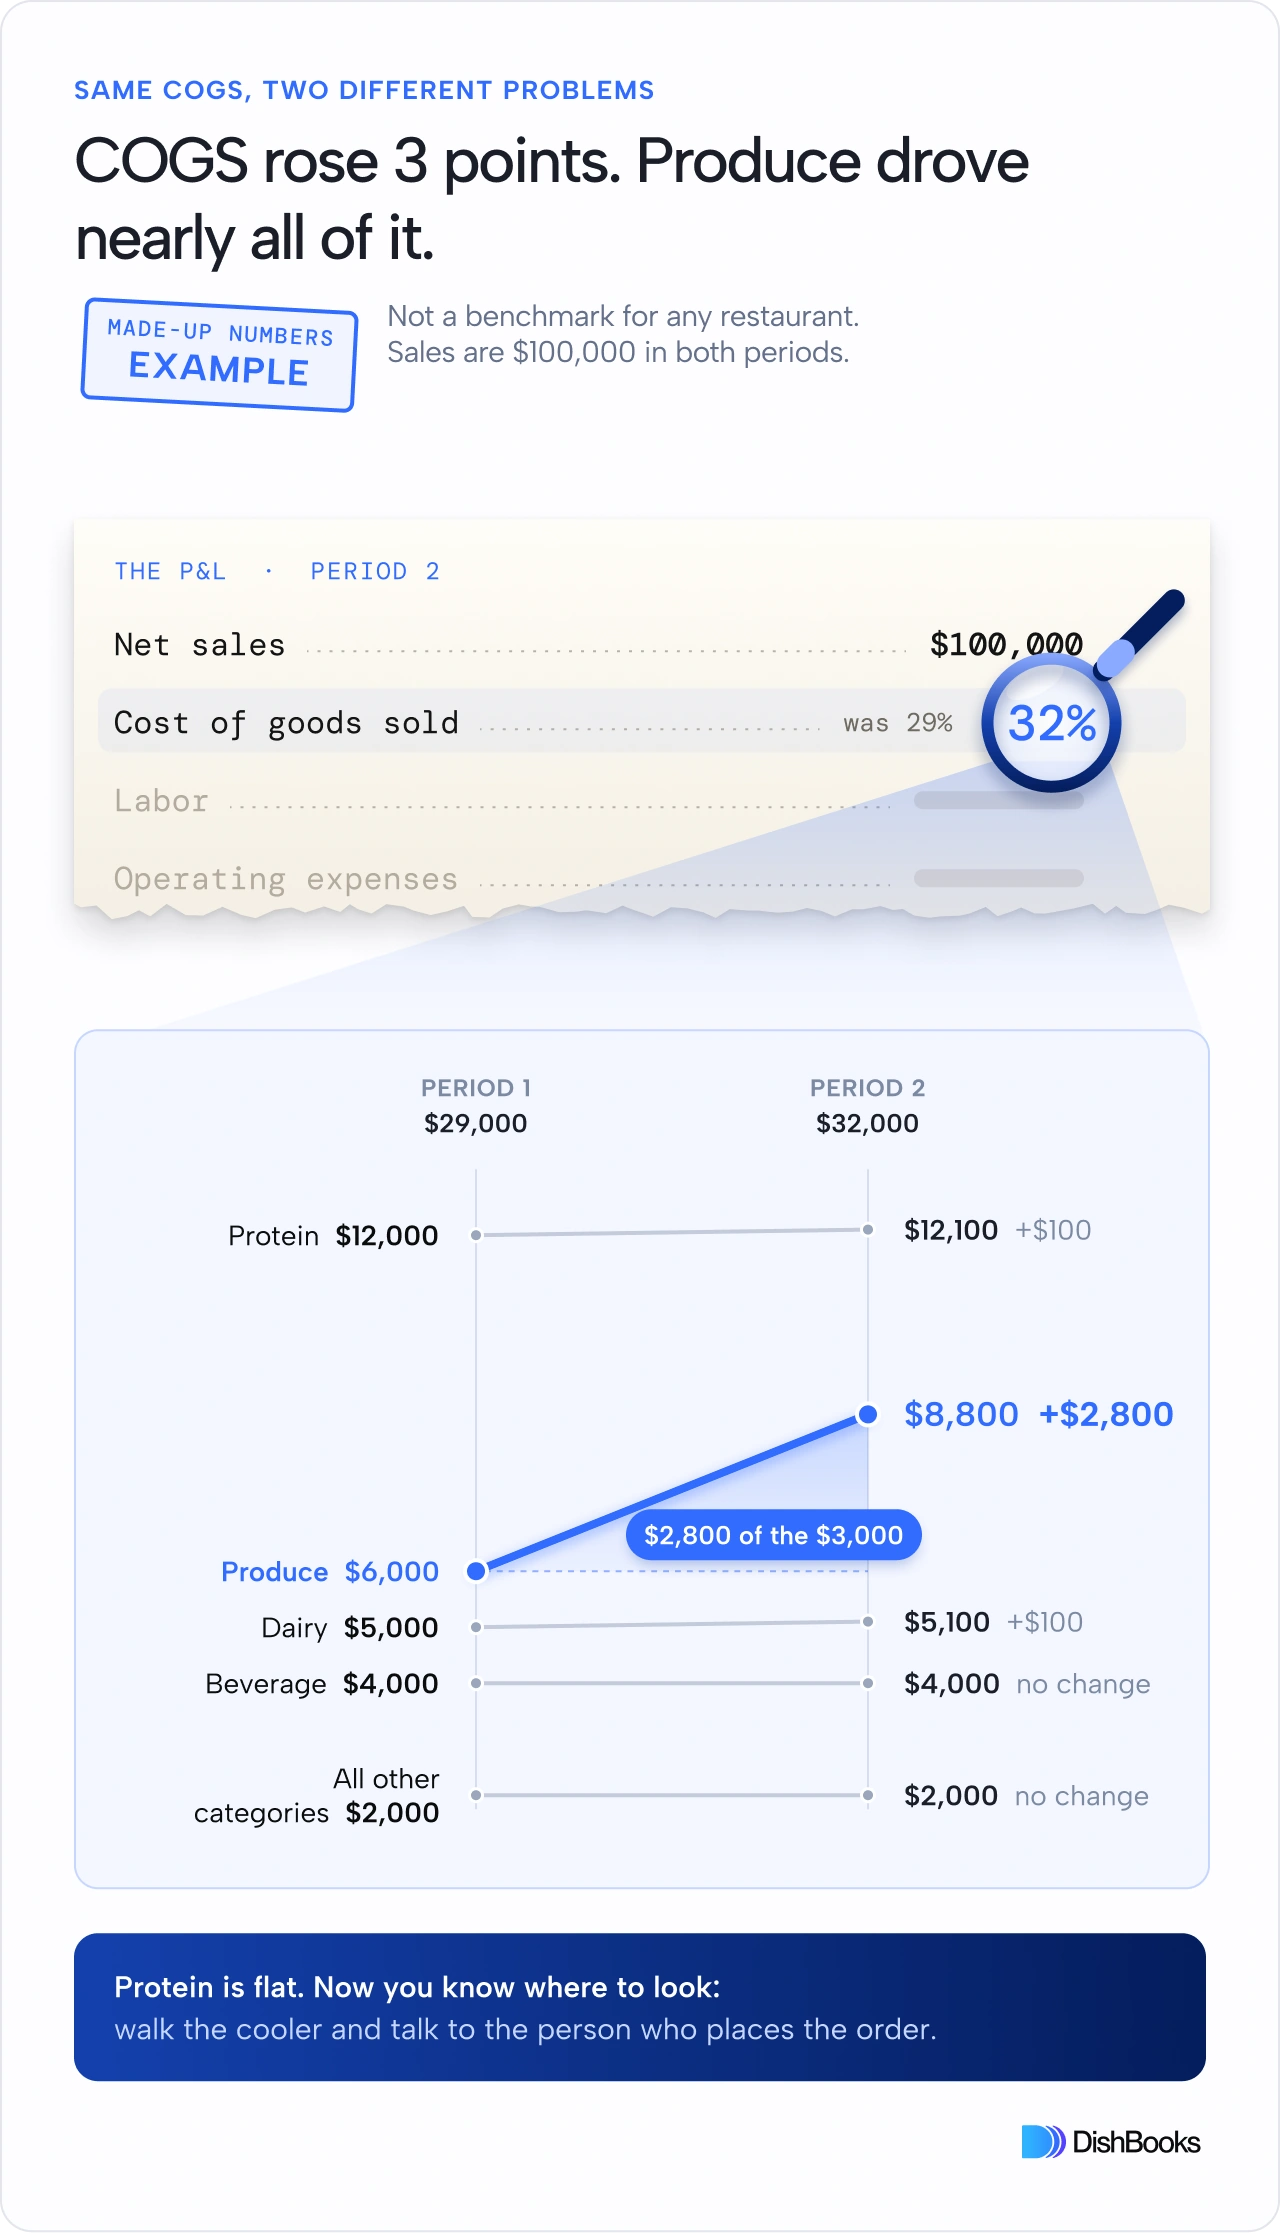
Now you know where to look. Is the kitchen over ordering? Is produce spoiling before it gets used? Is a vendor sending product that cannot be served? You can answer those by walking the cooler and talking to the person who places the order. They are far better questions than "how do we get the number down?"
The same breakdown tells you next period whether the fix worked. It also shows you the next problem when it arrives, because pain points change over time. The line that hurt you this period may be fine next period, and a different one may jump. Reading COGS by category every period is how you keep up.
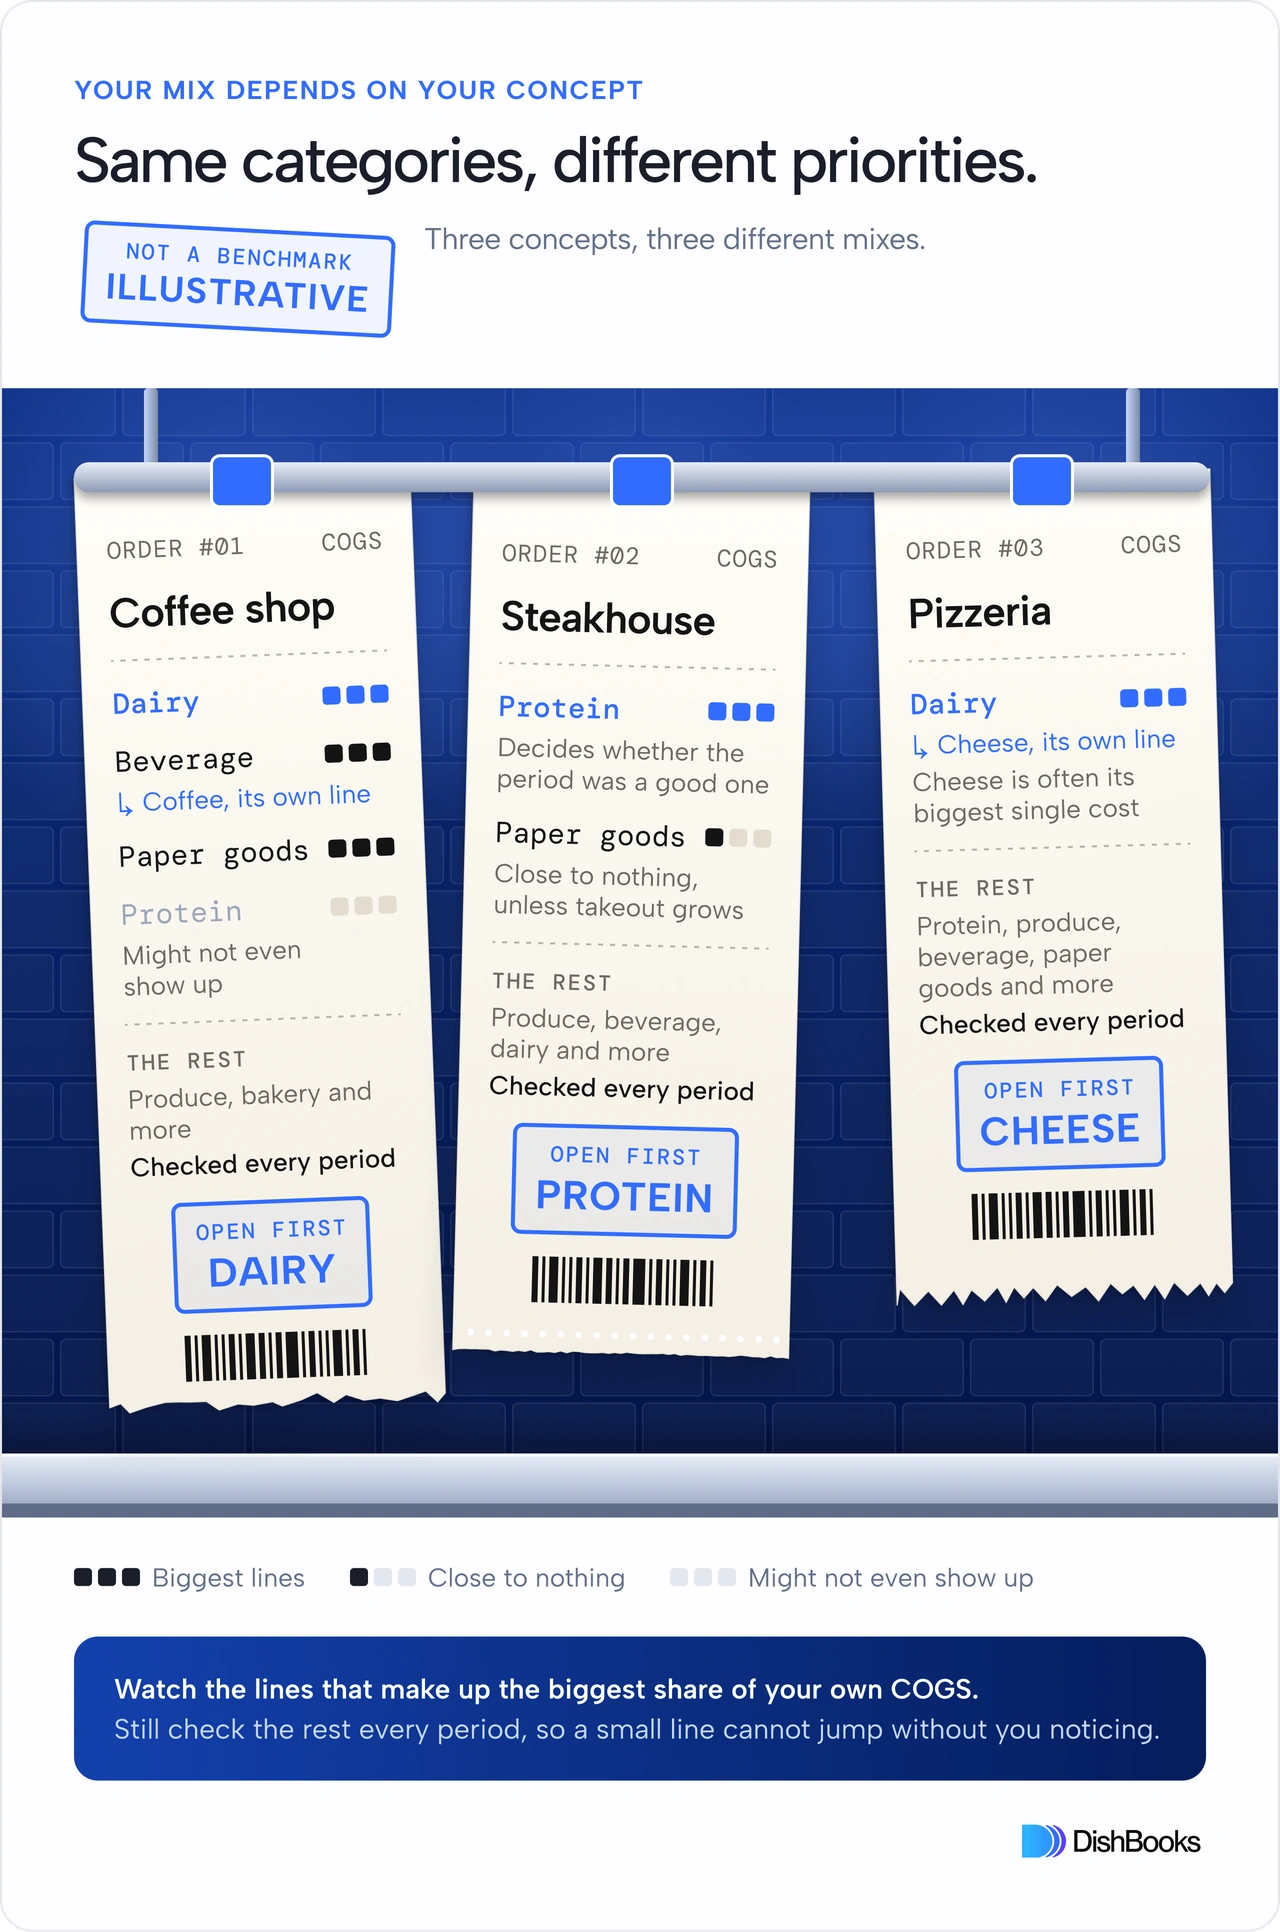
There is no single right order for these categories. It depends on the concept, and a list that ranks them the same way for everyone will be wrong for someone.
Take a coffee shop. Dairy, coffee, and paper goods are its biggest lines. Milk goes into most drinks, and every drink leaves in a cup with a lid and a sleeve. Protein might not even show up.
Now take a full-service dinner house built around steaks. Protein decides whether the period was a good one. Paper goods are close to nothing, unless takeout grows.
A pizzeria is the less obvious case. It looks like a business built on dough and toppings, but cheese is often its biggest single cost. That puts dairy at the top of the list, and it is a good reason to break dairy down further, so cheese gets a line of its own instead of sharing one with milk and butter.
Same categories, completely different priorities. That is why a rule like "watch your protein" does not help every operator. Watch the lines that make up the biggest share of your own COGS, and still check the rest every period so a small line cannot jump without you noticing.
Open your last P&L and check each line against the period before it. Put sales and COGS side by side while you do it. A line that rises with sales is doing what it should. A line that rises faster than sales is the one to look at.
Did protein move more than your sales did? If sales were flat and protein went up, look at portions and vendor prices first.
Did produce go up without a menu change? That often points to over ordering, or to product spoiling before it is used. Walk the cooler and compare what is on the shelf with what was ordered.
Did dairy move while your drink and dessert sales held steady? Check for a price change from your vendor. For a coffee shop or a pizzeria, this is the first line to open.
Are you buying more than you use? Bread goes stale fast, and dry goods are easy to over order because they keep. Count what is on hand against what you used.
Does your liquor, beer and wine cost line up with what you sold? A gap can mean heavy pours, drinks that were never rung in, or product walking out the door.
Does your coffee, tea and soda cost line up with what you sold? A gap can mean waste or free drinks.
Did paper goods rise faster than your to-go orders? Check what is being used and what is being ordered.
Each question sends you to a specific place to look, and most of them are answered in the kitchen, not at a desk.
If you run more than one location, the categories matter even more. Two locations can post the same total COGS for completely different reasons. One might have a produce problem. The other might be running heavy on protein portions.
A combined number hides both, and you end up applying one fix to two different problems. A category breakdown by location shows each one, so you fix the right thing in the right place. Comparing periods of the same length keeps the picture fair, since a period with an extra weekend can make a line look worse than it is.
COGS is one-half of prime cost, which is COGS plus labor. Prime cost for restaurants is the number most operators watch first, because it is the biggest cost you can steer. Reading COGS by category first makes the prime cost number much easier to act on, since you already know which line moved before you ask what to do about it. If you want the full picture, start with how to calculate prime cost, and then see how every line fits together in a restaurant P&L.
DishBooks is AI-powered accounting software for restaurants, and it breaks COGS out by category on your P&L. You see it period by period and location by location. You can pull a single line, like produce, and compare it across periods without building a spreadsheet. You are not limited to the lines above, either. You can add as many cost categories as your concept needs, so protein can be split into beef, poultry and seafood, or cheese can get a line of its own. If you want a COGS report that goes beyond one total, this is where it starts.
Dex AI, the financial assistant inside DishBooks, can answer questions about your own books, like "what drove COGS up last period?" It points you to the categories that moved. You decide what to do about it.
That 32% at the top of this blog was never the problem. It was the alarm. One total can tell you that something moved, and nothing more. Broken out by category, the same number tells you which shelf to check, which vendor to call and what to ask the person who places the order. The cost on the P&L is the same either way. What changes is whether the next two weeks go to guessing or to fixing the line that moved.
What does COGS stand for?
Cost of goods sold, also called cost of sales. It is what left the kitchen and went out to a table: the cost of the food, drinks and packaging behind what you sold.
How does COGS accounting work for a restaurant?
It records the cost of what you sold against your sales on the P&L. Done by category, it shows which part of that cost changed, so you know which line to look at first, whether that is protein, produce, bakery or beverage.
What is a good COGS percentage for a restaurant?
There is no single number that fits every restaurant. A steakhouse, a coffee shop and a pizzeria carry very different mixes, so a target that works for one will mislead another. The most useful comparison is your own COGS by category, period over period.
Which COGS categories should I watch first?
Start with the ones that make up the biggest share of your own COGS. For many restaurants that means protein and produce. A coffee shop should start with dairy and paper goods, and a pizzeria with dairy. Still check every category each period, because a small line can jump.
How often should I check COGS by category?
Every period. A category that drifts for one period is easy to catch. One that drifts for three is expensive.
What is the difference between COGS and prime cost?
Prime cost is COGS plus labor, including wages, taxes, benefits and overtime. COGS is the food, drink and packaging half of it.
