


Open a full profit and loss statement, and most operators react the same way: too many numbers, a tiny font, no idea where to look. Most never trained as accountants, so they close it and go back to the floor.
That costs money. Restaurants run on tight margins. Vendors change their prices, wages move, turnover means more training, and none of it waits for you. If you cannot see where the money went last period, you cannot decide what to change this period.
This post reads one P&L in order, line by line. No accounting degree needed.
P&L is short for profit and loss statement. It answers one question: after everything you sold and everything you spent, what was left?
It is also the only report that puts every cost next to your sales, so it is where you catch a cost drifting before it eats the profit. Protein prices creep up. Overtime builds. A subscription nobody uses keeps renewing. Each one looks small. Together, they decide whether the period was a good one.
Everything below uses one example: a full-service restaurant and one four-week period. The numbers are made up for this example, but they are built to look like a real restaurant's books.
Every line shows two figures: dollars, and those dollars as a percent of net sales. The percent is the one to watch. It lets you compare this period to the last one, even when sales move.
If you close your books by calendar month, read month wherever you see period. Nothing else changes.
A P&L is laid out the way an accountant thinks. An operator short on time asks different questions. How much did we sell? What did the food and the crew cost? What can I still change? What did we keep? Read it in that order.
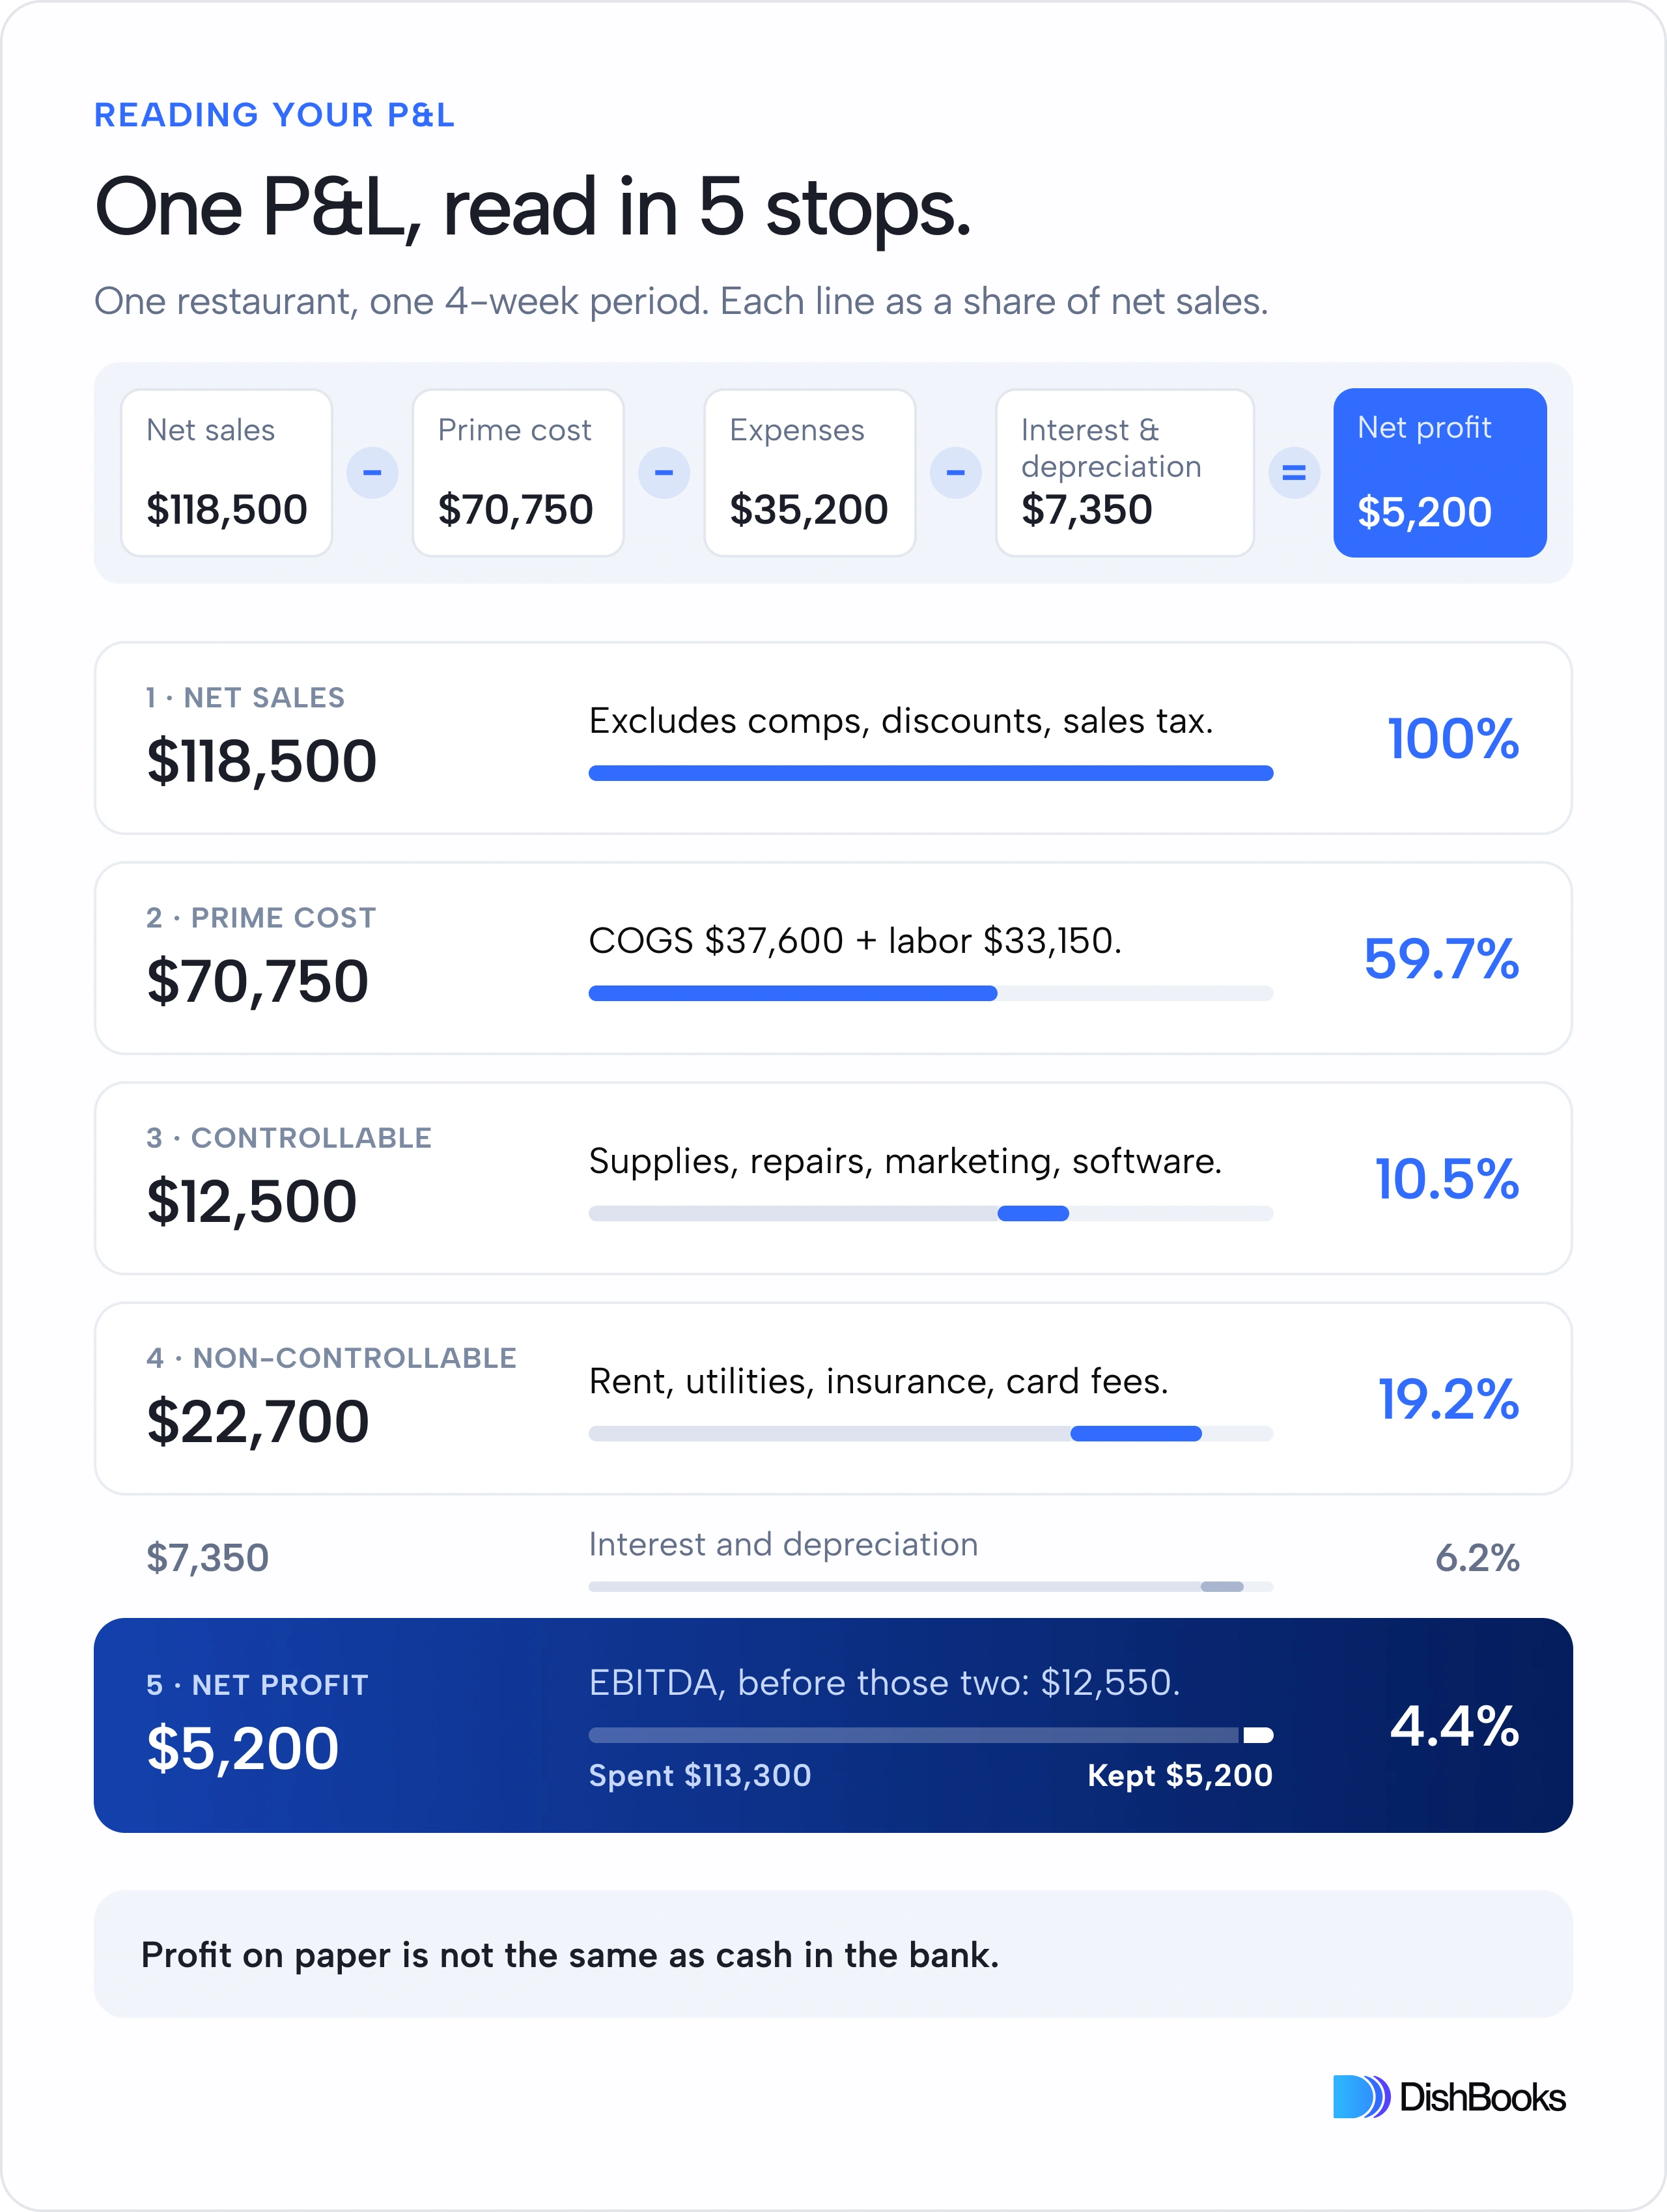
Net sales is total sales minus comps and discounts. The sales tax you collect for the state is not part of it. Every percent on the P&L is a slice of this number.
Check whether it is up or down from last period and from the same period last year. Rent does not shrink when sales do, so a slow period makes every other line look worse.
Prime cost is your two biggest costs added together: cost of goods sold (COGS) plus labor. COGS is the cost of what you served, from protein, dairy, produce, and beverage to paper goods. In the example, COGS is $37,600, and labor is $33,150, so prime cost is $70,750.
Divide that by net sales, and you get 59.7%. Just under 60 cents of every sales dollar went to food and crew before anything else was paid.
Where operators go wrong: they watch the dollars. Dollars rise whenever sales rise, so a bigger number is not always bad news. The percentage tells you whether costs are keeping pace. A prime cost of $75,000 is comfortable on $130,000 of sales, but a problem with $110,000 of sales.
Then split it. If prime cost moved, did COGS move or did labor? And within COGS, which category? The answer tells you what to do next.
Next come the costs you can still change this period: supplies and cleaning ($4,200), repairs and maintenance ($2,800), marketing ($3,600), and software subscriptions ($1,900). Together, that is $12,500.
Prime cost is controllable too, and it is the biggest one, so it got its own stop. This stop covers the rest.
Look for the line that jumped. Repairs that doubled. A marketing spend nobody remembers approving. This is the stop where a five-minute look usually turns up something to act on.
These are the costs you have little say over: rent ($10,800), utilities ($5,100), insurance ($2,300), card processing fees ($3,300), and accounting and legal ($1,200). Together, that is $22,700.
Rent is the clearest case. It is the same every period. Know what you pay, but you do not need to check it every period, because nothing changes until the lease does. Utilities sit in the middle: habits and equipment can trim the bill a little, but it mostly follows the season. Card fees rise and fall with sales.
Read this stop quickly. You are looking for a surprise, like an insurance bill that jumped at renewal. If nothing jumped, move on.
The bottom line. After every cost above, plus $7,350 of interest and depreciation, $5,200 is left. Interest is what you pay on loans. Depreciation spreads the cost of a big purchase, like an oven, across the years you will use it.
Add interest and depreciation back, and profit is $12,550. That number has a name: EBITDA. It shows what the restaurant earns from running the business, before loan interest and past equipment purchases. Net profit, total sales, and EBITDA are the headline numbers on the DishBooks dashboard.
Look at both. Net profit is what is left. EBITDA shows whether the day-to-day business is earning. A loan taken out for the build-out can shrink net profit while EBITDA shows the business itself is sound.
The most common misread is treating every expense as equally fixable. One habit prevents it: for each expense, ask whether you can change this period's number.
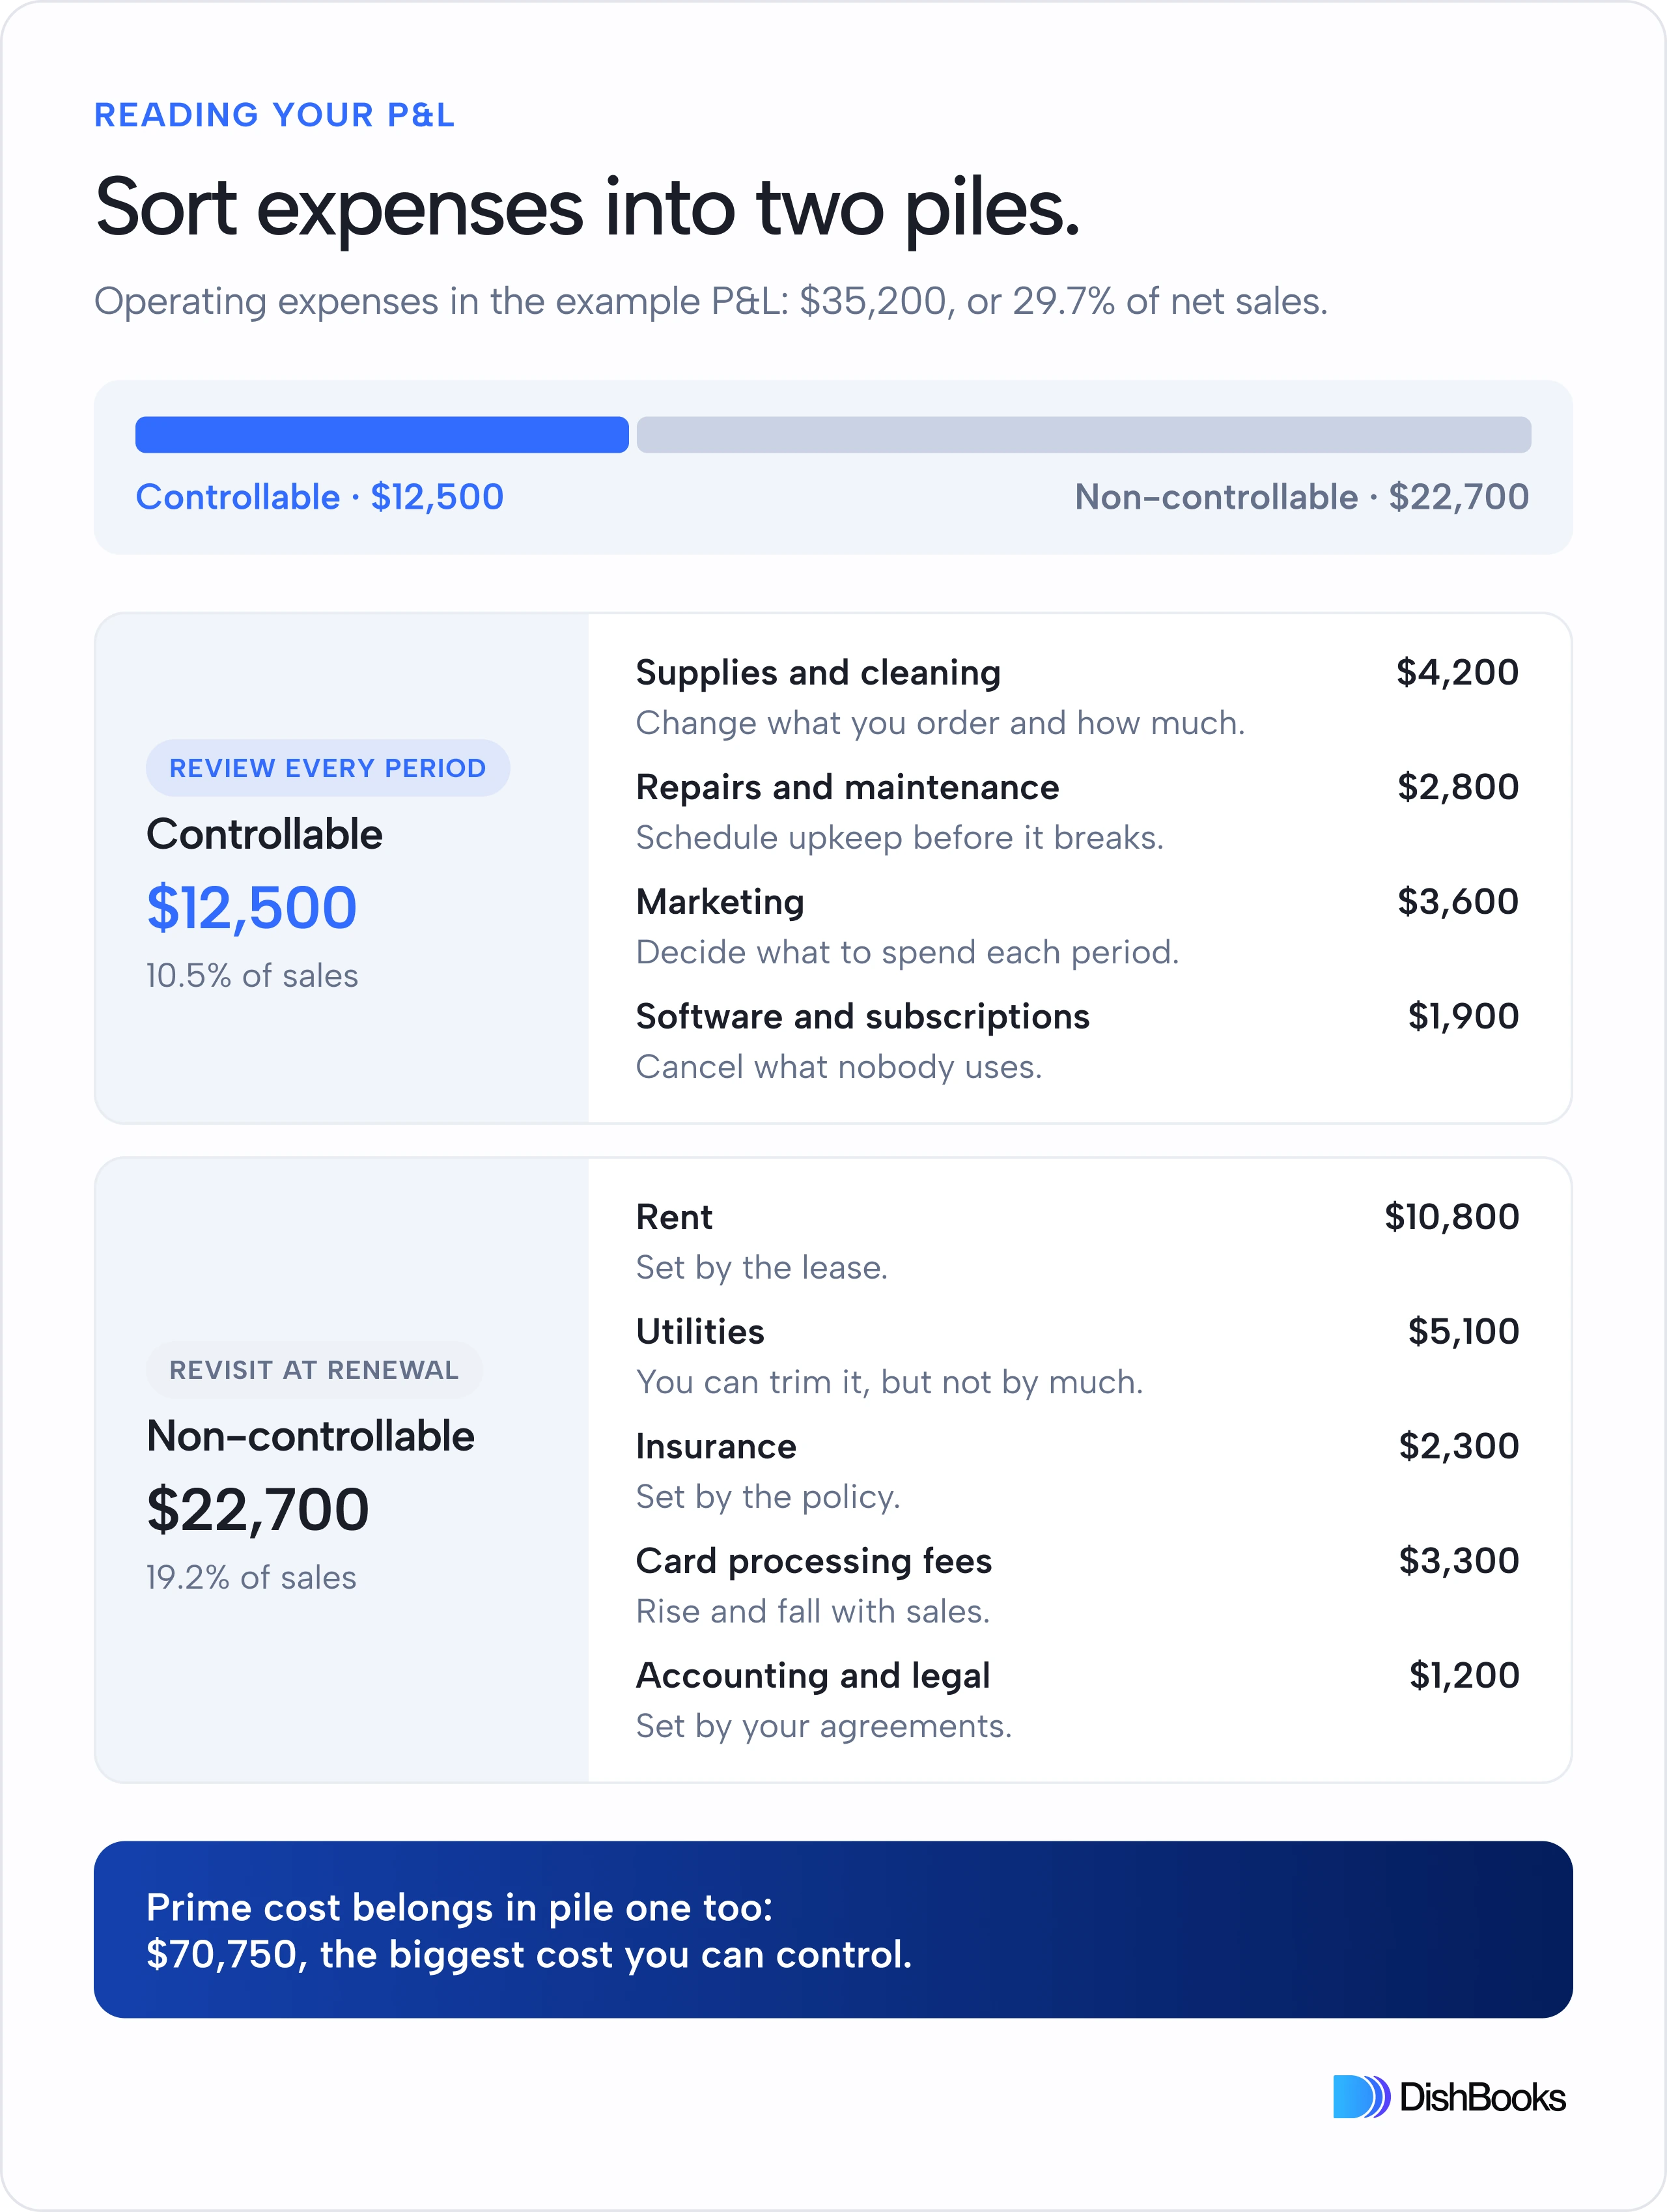
Spend your time on pile one, and look hard at pile two only when a lease or contract renews. In pile one, COGS by category matters most. One total COGS number tells you something moved. Protein, dairy, produce, beverage, and paper goods shown separately tell you what moved.
Every restaurant is different, so no single number fits all of them. A rough range still lets you check your own numbers and see which lines deserve a closer look. Industry benchmarking, largely built on a pre-pandemic baseline, splits a typical independent restaurant's sales dollar about like this:
Prime cost has its own rule of thumb: full-service restaurants tend to run 60 to 65% of sales, quick-service 55 to 60%. Above that range, there is little left to pay for everything else.
In our example, prime cost is 59.7%, inside the full-service range. Everything else comes to 29.7 cents, close to typical, and profit is 4.4 cents, in the usual range.
Use ranges as a starting point, not a grade. A downtown restaurant with high rent will look different from a suburban one. When a line sits outside its range, ask why.
The example restaurant made $5,200. That does not mean the bank balance rose by $5,200. Profit and cash drift apart for a few reasons:
So, a P&L can show a profit in a period when the bank balance fell, and the other way around. Neither is a mistake. The P&L asks whether the business is earning. The bank balance asks whether you can cover this week's bills. You need both.
After you have read yours, you should be able to answer these:
If you can answer all four, you have read your P&L. If one of them stops you, that is the part of your books that needs to be easier to see.
DishBooks is AI-powered accounting software for restaurants. A full P&L is long because every account gets its own line. DishBooks gives you shorter ways to reach the answers to those four questions:
The numbers are there. What to do about them is your call.
What is the difference between a P&L and a balance sheet?
A P&L shows how the business performed over a stretch of time, such as one period or one year. A balance sheet is a snapshot of one day: what the business owns and what it owes.
How often should I read my P&L?
Once every period or month, when the books close. That is often enough to steer, and it is the same rhythm most operators and their accountants already work in.
What is a good profit margin for a restaurant?
For a typical independent restaurant, industry benchmarks put pre-tax profit at somewhere around a nickel of every sales dollar, often less. Yours will vary with your concept and your location. The better question is whether your number is moving in the right direction.
Do I need an accountant to read my P&L?
No. You need an accountant to set up your books and file your taxes. Reading the P&L is a different job. If you work with one, knowing what each line means makes the monthly conversation shorter and more useful.
Read a restaurant P&L in five stops: net sales, prime cost, controllable expenses, non-controllable expenses, and net profit. Judge each line as a percent of sales, not in dollars.
Spend your time on the costs you can change, glance at the ones you cannot, and remember that profit on paper is not cash in the bank.
